Emini Futures Trading / Reverse Head And Shoulders
 April 22, 2011 at 4:51 PM
 TURN THE TV OFF AND JUST LOOK AT THE CHART
I'm not here to regurgitate CNBC and all the fundamental bullish/bearish arguments that are out there. If you are a trader you already know all the news out there so what I want you to do is this...
Turn off the TV, set your personal opinions aside and look at the chart in front of you and tell me this, "What do YOU see?"

This is a technical look at the S&P market. Bigger picture stuff:
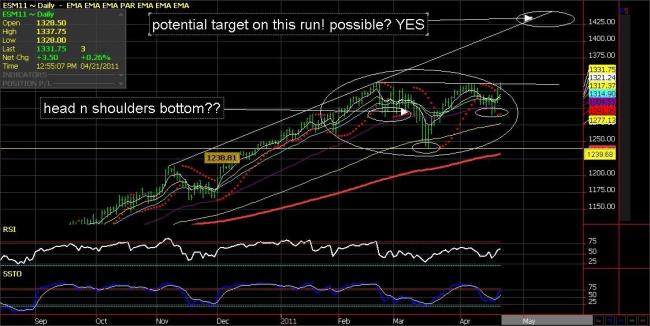
What I'm displaying here is a potential head and shoulders bottom. One of the oldest and hardest formations to find but this picture fits the mold. Why? The head is defined by the low @ 1241.25 (March 17th low). The left and right shoudlers are almost symmetrical 1287.75 (Feb 24th low) and 1290.25 (Monday's low) and the neckline runs straight across the flat top@ 1336.00-1338.00. With a close above the neckline this will potentially open the door for much higher prices and ultimately to 1436 in the JUNE S&P. I don't know what fundamental news takes us there but one should be buying dips and looking for higher prices. Does that mean its going to go in a straight line and hit the target? NO. In fact, inside the potential head and shoulders bottom we have a potential "sell signal" on the hourly chart . This sell signal should offer us a level to get "LONG" this market and ride it through the neckline.

Smaller picture stuff:
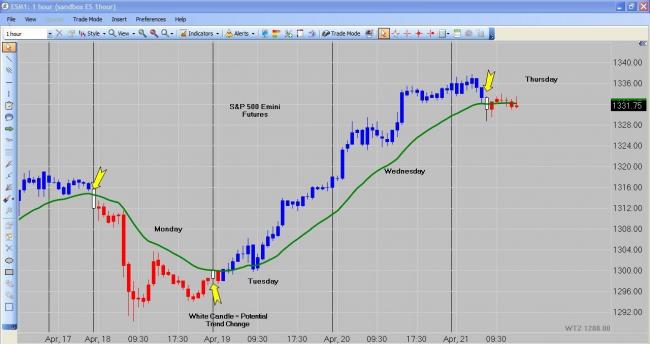
Chart above is a snapshot of the CFRN Indicators(http://www.cfrn.net/) inside the DTPro platform. Red= sell/ Blue= buy and white= trend change. The green line is refered to as the "bullish bearish cross" or BBC line. Once the candles change you're looking for an entry.Trading's not easy but it is that simple! And we got that today. So in the short term, if we continue to close under 1337.00/1338.00 then we should look for a correction from these levels. Where? 1st potential target would be 1319.00 or as low as 1310.00(the gap) or more importantly until our CFRN indicators change colors again. If our candles start changing colors from red, then to white, then to blue and we get a cross back above the BBC line will start probing the long side.
Can you tell I make my trading decisions using charts?
B. Schlichter

Our Weekly Trading Zones and Chart Room Access are emailed to members prior to the open every Monday. Join us M-F from 9am-1pm Eastern for Live Charts, Live Trading, and Lively Discussion.
Trading's not easy, but it can be simple!


Reader Comments