Emini Fibs Made Simple - For FREE
 August 10, 2019 at 3:20 PM
Don't Waste $20k on "Special" Fib Tools and Training!
Fibonacci made simple is akin to Jumbo Shrimp. In other words, "Is that really possible?" For the uninitiated, let's turn first to the man and then the math.
Who? - Fibonacci, or more correctly Leonardo da Pisa, was born in Pisa in 1175AD.
What? - Fibonacci is perhaps best known for a simple series of numbers, introduced in Liber abaci and later named the Fibonacci numbers in his honour.
The series begins with 0 and 1. After that, use the simple rule:
Add the last two numbers to get the next.
1, 2, 3, 5, 8, 13, 21, 34, 55, 89, 144, 233, 377, 610, 987,...
Why? Does this matter to an Emini Futures Trader...
FIBONACCI MADE SIMPLE
You could spend years attempting to unravel the mystery of the seashell, the flowering artichoke, multiplying rabbits or DNA. At the end of your exhaustive study you will be confronted with the following as it applies to Emini Futures Trading -
- After price has made a significant move (subjective)
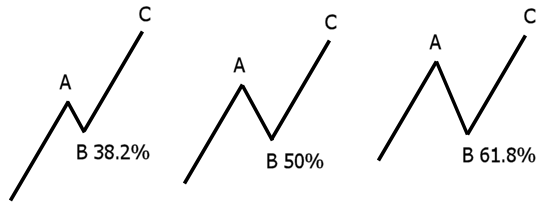
- There will be a retracement of 23.6% or 38.2% or 50% or 61.8% or somewhere in between
- If the retracement exceeds 61.8% it is then deemed a reversal and all bets are off

Fib Retracement Levels
Given the above facts, how does one know if price will retrace 23.6%, 38.2%, 50%, 61.8% or 100%? One doesn't. Therein lies the conundrum. The fact is, price will end its retracement at one of the listed levels or somewhere in between based not on mathematical formula, but on the actions of market participants.
HOW CAN FIBONACCI HELP AN EMINI TRADER?
As a standalone tool some say it's no better than flipping a coin. I heartily disagree as the coins in my pocket have only two sides. Flipping a 2 sided coin suggests that I could potentially be correct 50% of the time. The Fib coin as outlined above has a minimum of 4 sides with even more "space" in between. Does that mean it has no value at all?
Placed in the proper context and used simply as a tool versus a Holy Grail, it can indeed help a trader spot potential turning points in the market. Most of the time, when you draw fib retracement levels on a chart, you will notice that the fib levels line up with support and resistance areas that you would see anyway without drawing the lines. So while you really do not need to draw the lines in, seeing the area of confluence between the Fibonacci retracement level and fixed support and resistance such as the Weekly Trading Zones, a previous swing high or swing low, or even dynamic support and resistance as displayed by one of the CFRN Indicators - CF_SR / CF_MA1 / BBC can turn a subjective concept into a useful tool that may actually help you become a better Emini Trader.
Visit us this week in our Live Emini Training Room and we will share some charts to help you better visualize how these areas of confluence come together.
To join us, simply APPLY!
Watch the FIBS MADE SIMPLE VIDEO!
Visit us this week in our Live Emini Training Room and we will share some charts to help you better visualize how these areas of confluence come together.


