


Example Of Bullish Engulfing Pattern
(QQQ)(DIA)(SPY)(GLD)(FB)

Bullish Engulfing Pattern Defines Market Direction
One of the easiest candlestick signals to spot besides our consummate favorite the Doji, is the Bullish Engulfing Pattern. This is one of the 12 primary signals taught to me by candlestick mentor, Steve Bigelow.
A candlestick purist might debate whether or not the example I will show you on the chart below truly qualifies. The issue would be in the wicks. The point I need to make is that when trading Emini Futures intraday, it is extremely difficult to obtain the pure textbook definition of Bullish Engulfing as it might apply on a Daily Chart where the overnight Globex session is not taken into consideration.
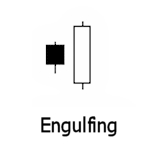
Bullish Engulfing Pattern: This is a powerful 2 candle pattern. The first candle is a narrow range candle that closes down for whatever time period is being observed from a 1 minute chart to a weekly, monthly, or even quarterly time frame. The sellers are in control based on the context of the downtrend. We have a narrow range bearish candle and volatility is low. The sellers appear to have lost their momentum. The second candle is a wide range bullish candle that "engulfs" the body of the first candle and closes near the top of the range. The buyers have overwhelmed the sellers as demand is now greater than supply. Buyers are now in control!
Due to the tremendous liquidity of the S&P 500 Emini Futures it is rare to see a gap intraday no matter what time frame you are observing from 1 minute all the way up to 1 hour. As you can see in the diagram above, after the close of the bearish candle the following candle opened lower than the close of the bear candle. Not uncommon with stocks on a daily chart but far less likely to happen in a Globex based futures environment. The example on the chart below is about as good as you will find but as you will see, it's good enough because the principles play out just the same.
I did mention in last night's post that I expected the 1444/1445 Weekly Trading Zone to be revisited based on how easily price slipped it through it on Monday. Not only was it revisited, the market spent 6 hours consolidating in and around the Zone. It's not magic, it's just market behavior that we see repeated again and again. Even if we can't explain it, through the simple power of observation we can profit from it.
 (ES) S&P 500 Emini Futures Hourly Chart
Notice that after proper consolidation occurred at the 1444/1445 Weekly Zone, price returned to the 1435/1436 Weekly Zone which has thus far been the low of the week since Monday's open. We will observe this pattern carefully and see where it leads us over the next few days. The first hourly candle after the Bullish Engulfing Pattern was good for a 5.75 point rally. Based on the ATR (average true range) of many days recently, that's more than a decent move. At the end of the daily broadcast I drew the trendline in to show you exactly where price needed to break to set the trade in motion.
For those of you who enjoy "The Secret Life of Candlesticks"© as much as I do, you'll be excited to know that I've invited Steve to do a webinar with us in the near future and to also visit us regularly on the radio program. Steve was one of the very first guests on CFRN way back in 2006 and we look forward to spending time with him again.
Connect with us: ![]()
![]()
![]()
![]()
![]()
![]()
Please leave a review on iTunes
5 DAY FREE TRIAL
 Editor
Reader Comments